


Investing in the stock market can feel overwhelming, especially for beginners trying to make sense of financial metrics. One of the most commonly used tools for evaluating stocks is the price-to-earnings (P/E) ratio. But what exactly does this ratio tell you, and more importantly, what is a good P/E ratio? This article breaks down the concept, explains how to use it effectively, and provides actionable insights for evaluating stocks like a seasoned investor. By understanding the P/E ratio, you can make more informed decisions and navigate the stock market with confidence.
Understanding the P/E Ratio
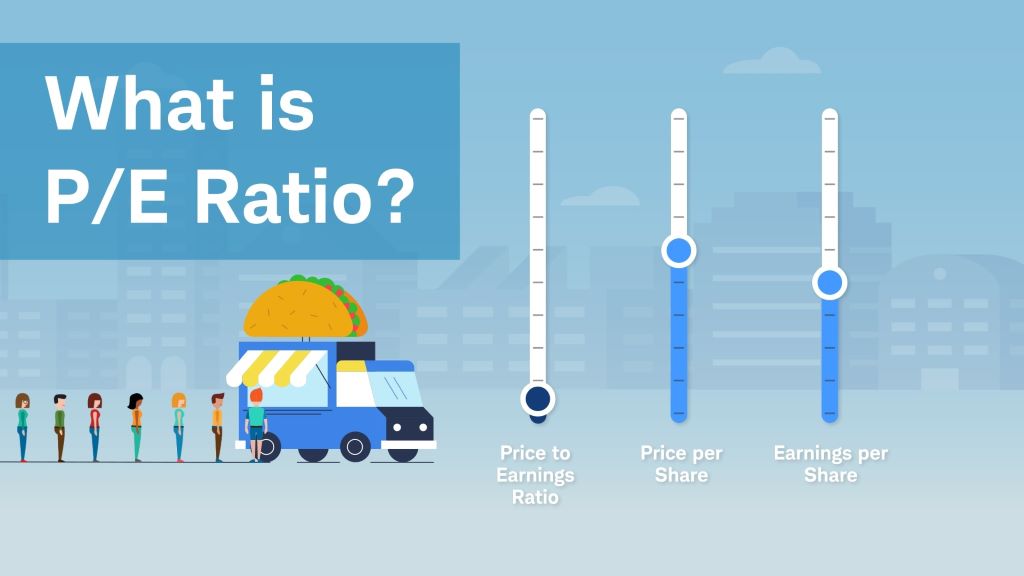
The P/E ratio is a financial metric that measures a company’s stock price relative to its earnings per share (EPS). It is calculated by dividing the current stock price by the EPS, which reflects how much investors are willing to pay for each dollar of a company’s earnings. For example, a stock with a price of $50 and an EPS of $5 has a P/E ratio of 10. This means investors are paying $10 for every $1 of earnings. The P/E ratio provides a snapshot of a company’s valuation, but determining what is a good P/E ratio depends on various factors, including the industry, market conditions, and the company’s growth prospects.
The P/E ratio comes in two main forms: trailing P/E and forward P/E. The trailing P/E uses earnings from the past 12 months, offering a concrete view based on actual performance. In contrast, the forward P/E relies on projected earnings for the next 12 months, which can be useful for assessing future growth potential but is less certain. Both metrics have their place, and understanding their differences is key to evaluating stocks effectively.
Factors Influencing a Good P/E Ratio
Determining what constitutes a good P/E ratio is not a one-size-fits-all process. Several factors influence whether a P/E ratio is attractive or concerning. For instance, industries have different average P/E ratios. Technology companies often have higher P/E ratios due to their growth potential, while utility companies typically have lower ratios because of their stable but slower growth. Therefore, comparing a company’s P/E ratio to its industry average is essential for context.
Additionally, market conditions play a role. During bull markets, P/E ratios tend to be higher as investor optimism drives up stock prices. Conversely, in bear markets, ratios may compress as prices fall. Growth prospects also matter. A company with strong future earnings potential may justify a higher P/E ratio, while a company with stagnant growth might warrant a lower one. For example, a tech startup with innovative products may have a P/E ratio of 50, signaling high investor confidence in its future, while a mature retail chain might have a P/E of 15, reflecting steady but limited growth.
To dive deeper into stock evaluation, resources like studyofstocks.com offer valuable insights into industry benchmarks and financial metrics. By comparing a company’s P/E ratio to its peers and considering its growth trajectory, you can better assess whether a stock is overvalued, undervalued, or fairly priced.
How to Use P/E Ratios in Stock Evaluation
Using the P/E ratio effectively requires more than just looking at the number in isolation. Here are practical steps to incorporate it into your investment strategy:
- Compare within the industry: A P/E ratio that seems high in one sector may be normal in another. Always benchmark against industry peers.
- Consider growth rates: Use the PEG ratio (P/E divided by earnings growth rate) to account for growth. A PEG below 1 may indicate an undervalued stock.
- Look at historical trends: A company’s historical P/E can reveal whether its current ratio is unusually high or low.
- Combine with other metrics: Pair the P/E ratio with metrics like price-to-book (P/B) or debt-to-equity to get a fuller picture.
- Account for market cycles: High P/E ratios may be more acceptable in a booming market, but caution is needed during downturns.
By following these steps, you can use the P/E ratio as part of a broader analysis rather than relying on it alone. For instance, a low P/E ratio might suggest a bargain, but it could also indicate a company facing challenges. Conversely, a high P/E ratio might signal overvaluation or simply reflect strong investor confidence in future growth.
Limitations of the P/E Ratio
While the P/E ratio is a powerful tool, it has limitations. For one, it doesn’t account for debt. Two companies with identical P/E ratios may have vastly different financial health if one is heavily leveraged. Additionally, the P/E ratio relies on earnings, which can be manipulated through accounting practices, potentially skewing the metric. Furthermore, it doesn’t capture non-financial factors like management quality, brand strength, or market disruptions.
Another limitation is that P/E ratios vary widely across industries, making cross-sector comparisons tricky. For example, comparing a tech company’s P/E to a manufacturing company’s P/E without context can lead to flawed conclusions. Therefore, always use the P/E ratio alongside other metrics and qualitative factors to make well-rounded investment decisions.
Practical Examples of P/E Ratio Analysis
To illustrate, consider two hypothetical companies: TechTrend and StableCorp. TechTrend, a fast-growing software company, has a P/E ratio of 40, while StableCorp, a utility provider, has a P/E of 12. At first glance, TechTrend appears expensive, but its high P/E may be justified by rapid revenue growth and innovation. StableCorp’s lower P/E reflects its predictable but slower growth. By comparing each company’s P/E to its industry average—say, 35 for tech and 15 for utilities—you can see that TechTrend is reasonably priced, while StableCorp might be undervalued.
Now, imagine TechTrend’s P/E spikes to 60 without a corresponding increase in earnings growth. This could signal overvaluation, prompting caution. Conversely, if StableCorp’s P/E drops to 8 due to a temporary market dip, it might present a buying opportunity. These examples highlight the importance of context when evaluating P/E ratios.
FAQs About P/E Ratios
-
What is a good P/E ratio for a stock?
A good P/E ratio varies by industry and market conditions. Compare a company’s P/E to its industry average and consider its growth prospects. A P/E below the industry average might indicate undervaluation, while a higher P/E could reflect growth potential.
-
Is a high P/E ratio bad?
Not necessarily. A high P/E ratio can indicate strong investor confidence in future earnings growth, especially for tech or growth companies. However, it may also suggest overvaluation, so context is key.
-
What’s the difference between trailing and forward P/E?
Trailing P/E uses past earnings, offering a reliable snapshot, while forward P/E uses projected earnings, which are less certain but useful for growth-focused companies.
-
Can I rely solely on the P/E ratio to pick stocks?
No, the P/E ratio should be used alongside other metrics like PEG, P/B, and debt-to-equity, as well as qualitative factors like management and market trends.
-
How does the PEG ratio improve on the P/E ratio?
The PEG ratio divides the P/E by the earnings growth rate, providing a more nuanced view of valuation by factoring in growth expectations.
Conclusion
Understanding a good P/E ratio is a critical step toward evaluating stocks like a pro. By comparing a company’s P/E ratio to its industry peers, factoring in growth prospects, and considering market conditions, you can make more informed investment decisions. However, the P/E ratio is just one piece of the puzzle. Combine it with other metrics and qualitative analysis to build a robust investment strategy. With practice and the right resources, you can use the P/E ratio to uncover opportunities and navigate the stock market with greater confidence.
Read More: How Can I Make Easy Income?